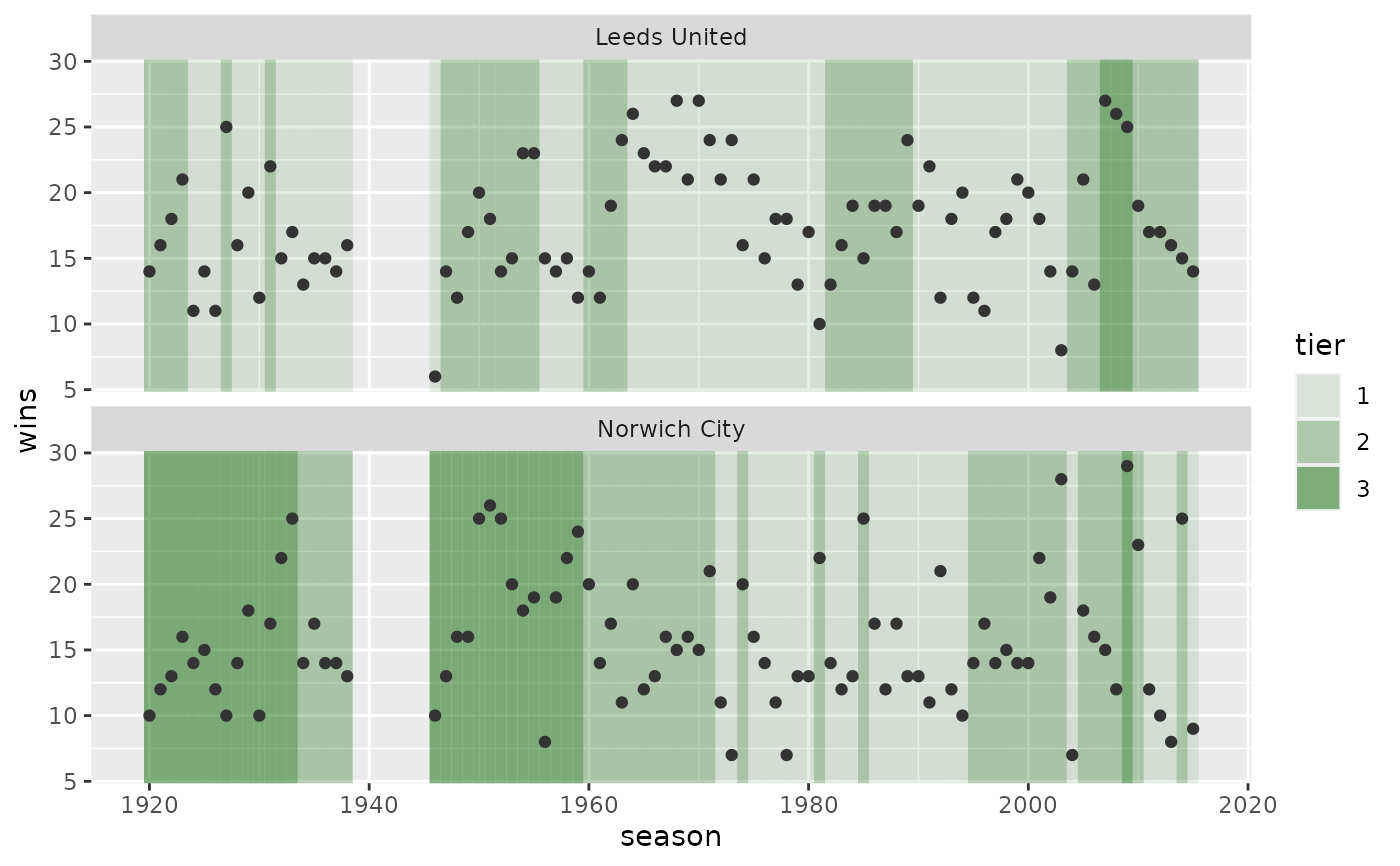
Returns a ggplot:
seasonon the x-axisfaceted by
teamhas two layers:
rectangles shaded by tier
points showing
winson the y-axis
Of the countries included in uss_countries(), only "england" has data for
more than one tier.
Arguments
- data_seasons,
data frame created using
uss_make_seasons_final().- aes_y
expression to show on y-axis.
- ncol,
integer-ish number of columns in facet.
Examples
leeds_norwich <-
  uss_get_matches("england") |>
  uss_make_teams_matches() |>
  dplyr::filter(team %in% c("Leeds United", "Norwich City")) |>
  dplyr::mutate(tier = as.factor(tier)) |>
  uss_make_seasons_final() |>
  dplyr::arrange(team, season)

# use default (wins)
uss_plot_seasons_tiers(leeds_norwich)